Despite extensive efforts to meet ever-growing demands, today's datacenters often exhibit far-from-optimal performance in terms of network utilization, resiliency to failures, cost efficiency, incremental expandability, and more. We present Xpander, a novel datacenter architecture that achieves near-optimal performance and provides a tangible alternative to existing datacenter designs. Xpander's design turns ideas from the rich graph-theoretic literature on constructing optimal expander graphs into an operational reality. We evaluate Xpander via theoretical analyses, extensive simulations, experiments with a network emulator, and an implementation on an SDN-capable network testbed. Our results demonstrate that Xpander significantly outperforms both traditional and proposed datacenter designs. We discuss challenges to real-world deployment and explain how these can be resolved. We provide below a brief exposition of our findings.
See our Technical Report for a detailed exposition.
Read more...
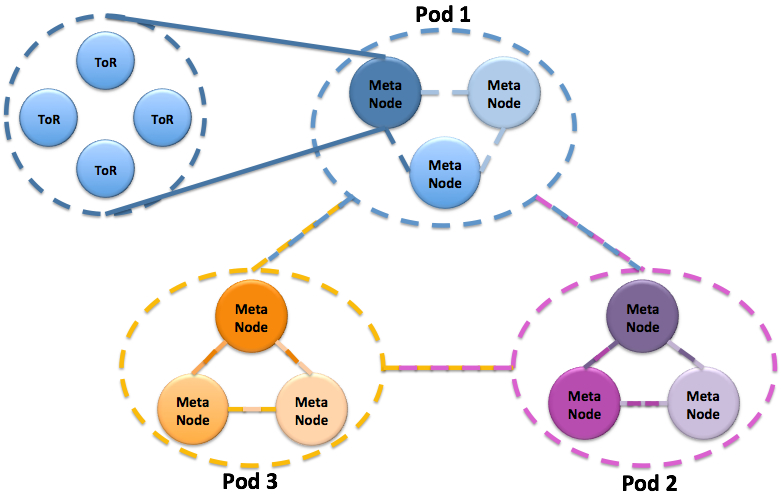
What is Xpander?
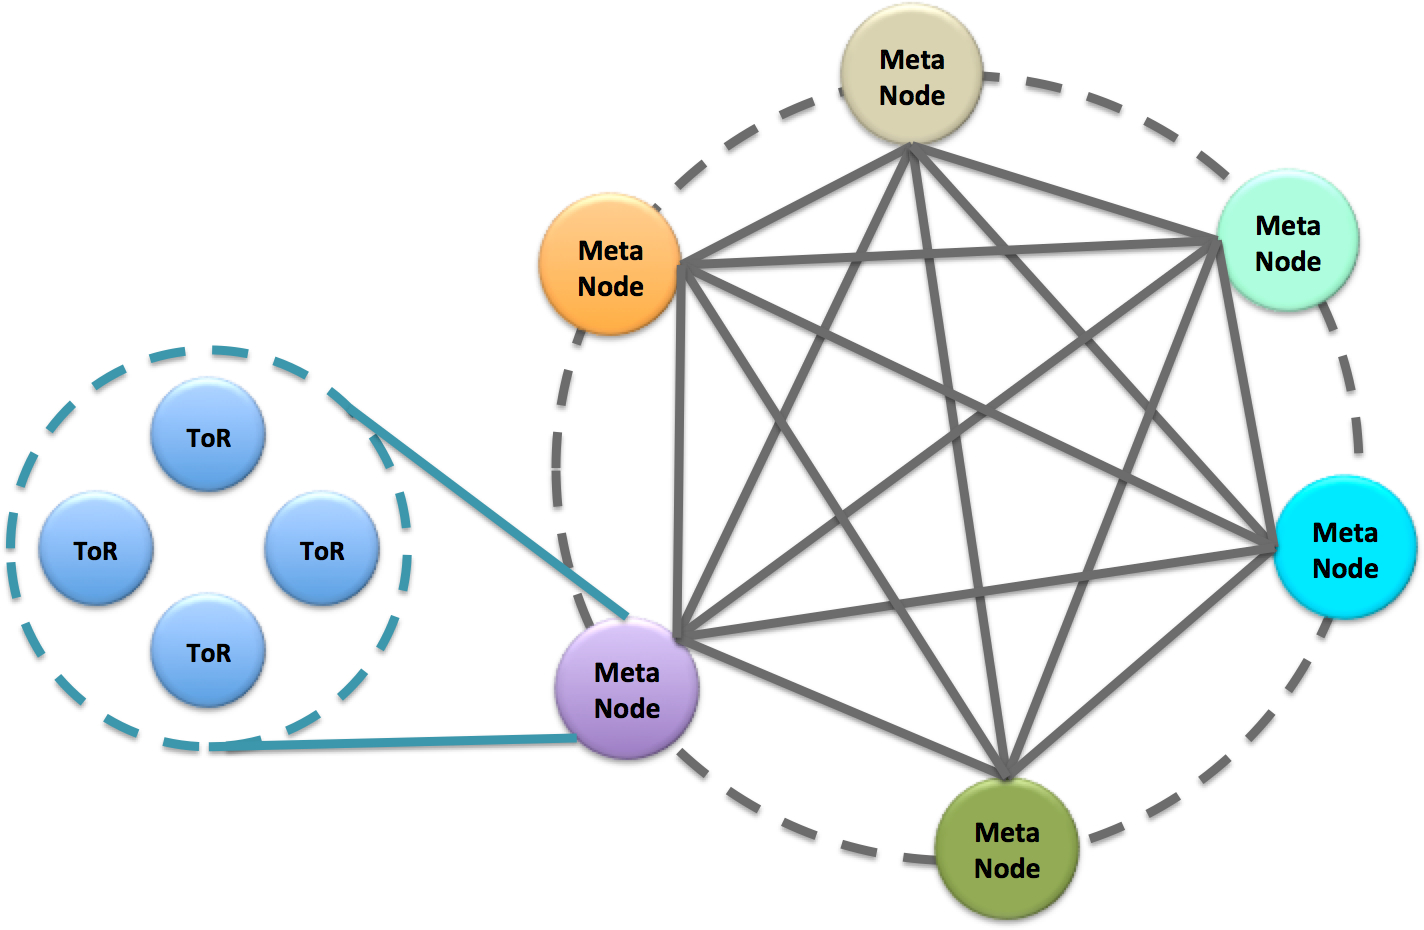
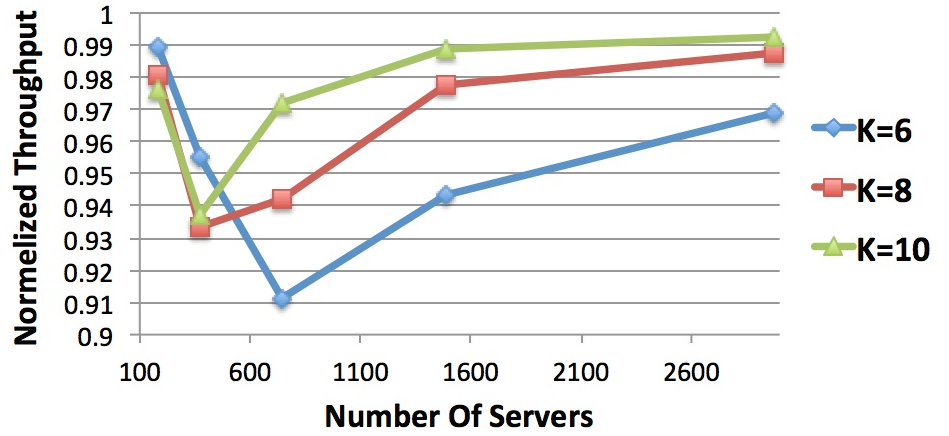
Xpander utilizes K-Shortest Paths as the routing protocol and MPTCP as the congestion control protocol. Combining these two protocols allows Xpander to achieve near-optimal network utilization. Figure 3 below describes the distance from a theoretical optimum of the all-to-all throughput of Xpander of different sizes and for different values of K.
Our results show that Xpander achieves network throughput that is within 10% of the best possible for any datacenter architecture. Table 1 shows our results for "skewed" traffic scenarios, i.e., when individual traffic flows are divided into small flows ("mice") and large flows ("elephants"). Observe that Xpander's network throughput was within 15% of the best attainable throughput for any datacenter in over 80% of evaluated scenarios and within 10% of the optimum in over 80% of evaluated scenarios.
| Distance from Optimum | Xpander Simulations In Range |
|---|---|
| throughput < 80% | < 1% |
| 80% ≤ throughput < 85% | 2.3% |
| 85% ≤ throughput < 90% | 16.14% |
| 90% ≤ throughput < 95% | 44.48% |
| 95% ≤ throughput | 36.61% |
Additional results can be found in the Technical Report, Section §4.
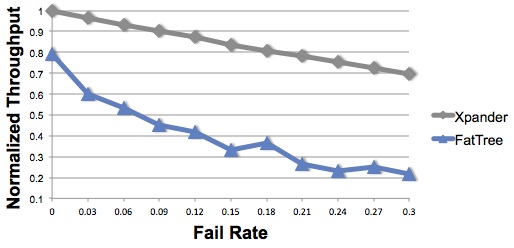
Xpander vs. Traditional Datacenters
Traditional datacenters employ a multi-rooted tree network topology, referred to as Fat-Tree. We compare Xpander and today's datacenter designing. Table 2 below shows a comparison between Xpander and Fat Tree for various switch port-counts. Observe that Xpander can support the same (or more) servers as Fat-Tree and achieve higher performance with significantly less network equipment.
| #Ports per switch | #Switches (Xpander/FatTree) | #Servers (Xpander/FatTree) | Throughput (Xpander/FatTree) |
|---|---|---|---|
| 8 | 80% | 100% | 121% |
| 10 | 100% | 100% | 157% |
| 12 | 80.5% | 100% | 103% |
| 14 | 96% | 103% | 122% |
| 16 | 80% | 100% | 120% |
| 18 | 90% | 100% | 137% |
| 20 | 80% | 100% | 118% |
| 22 | 89% | 102% | 121% |
| 24 | 80% | 100% | 111% |
Additional results can be found in the Technical Report, Section §5.
Additional results can be found in the Technical Report, Section §5.2.
Implementation on an SDN Testbed
We implemented Xpander and Fat Tree on OCEAN, an SDN-capable network testbed. The evaluated Fat Tree consists of 20 4-port switches and 16 servers, whereas the evaluated Xpander consists of only 16 switches supporting the same number of servers (16).
Table 3 presents a comparison Xpander vs. Fat Tree for three traffic patterns: (1) random shuffle, (2) many-to-one, and (3) one to many.
| Scenario | Min | Max | Average |
|---|---|---|---|
| Random Shuffle | 234% | 83% | 135% |
| One-to-Many | 94% | 138% | 123% |
| Many-to-One | 115% | 86% | 92% |
You can find additional information in the full Technical Report, Section §5.4.
Publications
Contact Us!
| Asaf Valadarsky | asaf.valadarsky@mail.huji.ac.il |